2010 Season Predictions Survey Results

Thanks to all who participated in the 2010 Season Predictions Survey. When the data to support this analysis was gathered, over 1,500 votes had been cast.
The primary goal of this exercise is to move beyond simply estimating a win-loss record. Selecting the percent confidence in a win on a game-by-game basis is not only much more accurate, it also allows for some interesting follow-on analyses.
Examining the schedule on a game-by-game basis also illustrates the difficulty in going undefeated in a 12-game regular season. Even if the Irish had a 90 percent chance of winning every game, they would still only have a 28 percent chance of running the table. A 75 percent chance of winning each game—close to the mean win confidence of the voters—translates into only a 3.2 percent chance of going undefeated.
The results below aren’t intended to be an exact 2010 season predictor, the guys at Football Outsiders have the corner on that market. Rather, they are intended to represent the expectations of the Irish fan base.
The Simple Viewpoint
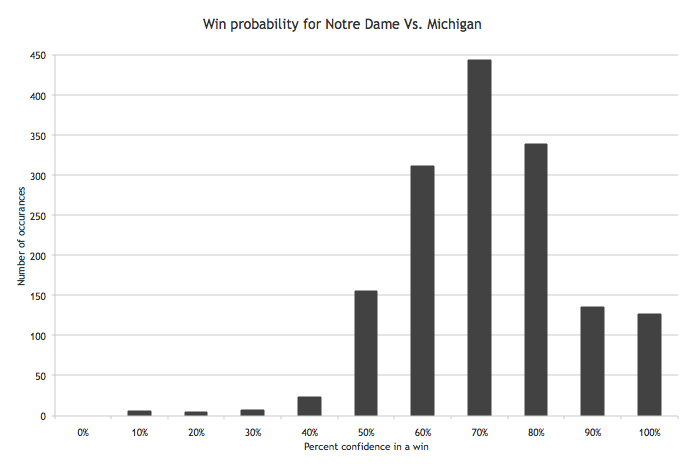
A typical win probability distribution is shown in the histogram below. Here Michigan has been used as an example, but the other games follow similar trends and are normally distributed.
From a simplistic perspective, the voting distribution described by this histogram translates to an average win probability of 71.4 percent and a standard deviation of 15 percent. Expressed differently, the majority of those polled (67.4 percent) believe the Irish have a 70 percent or better chance of beating Michigan, while 87.5 percent of voters believe Notre Dame has at least a 60 percent chance of beating the Wolverines.
The table below details the average win probabilities and standard deviations for each game in 2010. Larger standard deviations mean more scatter in the data, i.e more disagreement among the voters about Notre Dame’s chances of winning or losing the game. Lower standard deviations are indicative of a more consistent opinion regarding the outcome of the contest, i.e. more confidence in a win or loss.
[table id=242 /]
The mean win probability for all the games is 75.2 percent with a mean standard deviation of 15 percent—virtually identical to last year’s values of 76.1 and 13.8 percent respectively. USC is the obvious outlier with a 53.1 percent win confidence, but doesn’t significantly alter either value (77.2 percent mean win probability and 14.4 percent mean standard deviation excluding USC).
The simple way to translate the individual game average win probabilities to a season average win total is to sum the values. This equates to nine wins for the Irish. Multiplying the average win probabilities for each game gives the probability of an undefeated regular season at 2.7 percent.
The data also indicates which games are perceived to be sure wins, which could go either way, and which opponents are the most challenging. On average, voters predicted greater than a 90 percent win probability for Western Michigan, Tulsa and Army, and better than 80 percent win confidence for Purdue and Navy. Additionally, Western Michigan, Tulsa and Army have standard deviations below the 15 percent average (average of 9.6 percent for these three teams, high of 11.5 percent). In other words, the voters strongly agree that these three teams are the weakest opponents.
Michigan, Michigan State, Stanford, Boston College, Pittsburgh, and Utah all had average win probabilities between 60 and 80 percent (mean win probability of 66.4 percent), and relatively large standard deviations. These are games where voters believe the Irish have a slight advantage but the amount of variation suggests a relatively low confidence.
Finally, for the second consecutive year, the Trojans are the most feared opponent on the schedule as well as the one with the most disagreement. The contest against USC registered a 53.1 percent average win probability, with a very high 20.8 percent mean standard deviation.
There is, however, more confidence in a win this year despite being an away game for the Irish. It seems that the uncertainty surrounding the Trojan program and the lack of a proven head coach has bolstered fans’ confidence.
In summary, Western Michigan, Tulsa and Army are viewed as near certain wins, the Irish have slightly better than even odds against Michigan, Michigan State, Stanford, Boston College, Pittsburgh, and Utah, and USC is a coin flip.
Monte Carlo Simulation
As noted above, summing the individual win probabilities is a simple way to generate a season win total. But what about the variation of that win total? This is where Monte Carlo simulations are of value.
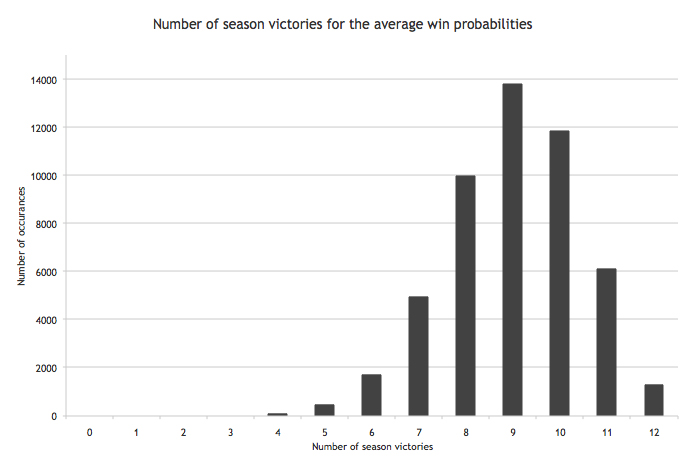
Using a large number (~50,000) of randomly sampled data points, a Monte Carlo simulation was performed with the average win probabilities in the table above. The results of this simulation are shown in the histogram below.
The results of the Monte Carlo simulation are consistent with the simple summation of game win probabilities, i.e. nine wins is the average expectation. But the variation in this expectation provides additional insight.
On average, voters predicted a 95.7 percent chance the Irish will win seven or more games, an 85.8 percent chance in eight or more victories, and a 65.9 percent chance in nine-plus wins. Expressed differently, the average voter predicts only a 4.3 percent chance Notre Dame will win fewer than seven games and a 71.1 percent chance of a record between 8-4 and 10-2.
The Optimists and Pessimists
The mean win probabilities used to generate the season win histogram above are indicative of the average voter prediction, i.e. they represent a 50 percent confidence interval of the data.
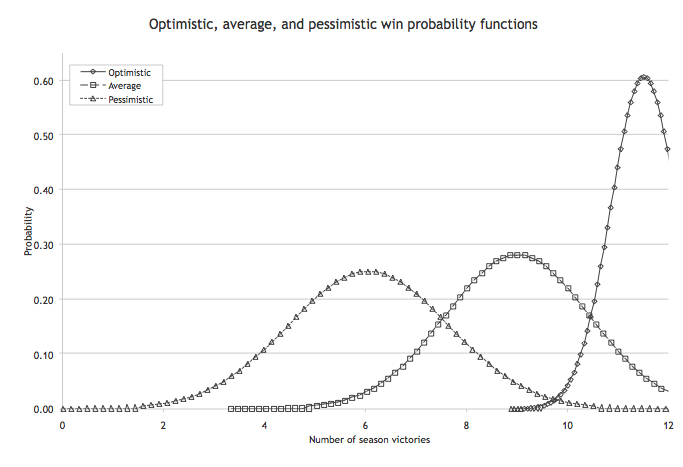
The outlying data, however, can be thought of as optimistic and pessimistic predictions. In other words, the five and 95 percent confidence intervals of the game win probabilities bound voter expectations by approximating optimistic and pessimistic views.
The plot below shows the normalized probability functions for the optimistic, average and pessimistic season win predictions. The average curve is effectively a discretized version of the histogram above, normalized to an integrated probability of unity.
Similar to the average predictions, the optimists and pessimists voted along the same lines for the second straight year. The 2009 optimistic win prediction was 11.4 wins with a standard deviation of 0.7 while the pessimistic prediction was 6.4 with a standard deviation of 1.6 wins. Compare these values to those represented by the curve above—11.5 wins for the optimists (standard deviation of 0.7) and 6.1 wins for the pessimists (standard deviation of 1.6)—and it is quite evident that the expectations in 2010 mirror those of 2009.
Where Did the Voters Go Wrong?
The average win probabilities rank the following teams as the five most difficult on the slate:
- USC
- Pittsburgh
- Michigan State
- Boston College
- Stanford
Absent from this list is Utah—a team that has compiled a 47-17 record (0.734), 5-0 bowl record, undefeated season, 10-4 (0.714) record against BCS conference teams, and a 19-5 (0.792) out of conference record over the past six years. Additionally, the Utes are 8-3 (0.727) in November away games since 2003. That kind of success shouldn’t be taken lightly.
Offensively, the Utes will have plenty of firepower with two very solid quarterbacks, speed and power options at the running back position, and a seasoned offensive line. Utah’s defense doesn’t return as many starters, but will field a strong front four and have plenty of experienced players waiting in the wings.
Given the uncertainty surrounding USC (new coaching staff and NCAA sanctions), Pittsburgh (retooled secondary, must replace three interior linemen and the nation’s 10th most efficient passer from 2009), Michigan State (three new offensive linemen and a host of new defensive starters), and Stanford (no Gerhart and significant coaching changes on defense), it seems Utah certainly belongs somewhere in the top five.
New Coaching Staff, New Quarterback, New Offense, New Defense…Same Expectations
The expectations for the 2010 Fighting Irish are virtually identical to last year. While a case can be made that Notre Dame should have been far better than 6-6 last season, an off-season of changes doesn’t often equate to a three-win improvement.
Save wide receivers coach Tony Alford, the entire coaching staff is new, and Alford has moved to a position he’s never coached before. The offense must adjust from a pro-style philosophy to a spread-based scheme, replace two of the most productive players in recent history—quarterback Jimmy Clausen and wide receiver Golden Tate—and break-in two new tackles. And for the fourth time since 2006, the defense will have a new coordinator and scheme as Bob Diaco implements his no-crease 3-4.
Moreover, the schedule doesn’t appear decidedly less challenging than a year ago. Notre Dame faces seven foes in 2010 they played in 2009 (Purdue, Michigan, Michigan State, Stanford, Boston College, Pittsburgh, Navy and USC), and replaces Nevada, Washington, Washington State, and Connecticut with Western Michigan, Tulsa, Utah, and Army. The Irish lost to five of the common foes in 2009, but the voters didn’t put the Irish as an underdog in a single contest in 2010.
The expectation is a nine-win season, as nearly three quarters of voters predict between eight and 10 wins. Kelly has a proven track record of winning and maximizing talent, and there is plenty of the latter on the current Irish roster. It seems that the bar has been set hoping he can do at Notre Dame what he has done everywhere else. And as this assessment has shown, he isn’t lying when he says that he has to win, and win right away.


