A Theory on College Football Performance: Part 2 – Institutional Factors

Part 2 of this series of articles will cover the effects of scheduling and the benefit that playing home games have on a program, and how these areas have affected Notre Dame. While Part 1 focused on the player impact on a program, recruiting and development—something the coach and his staff have greater control over—this article specifically looks at factors that tend to be tied to a school’s institutional management of its football program.
How It Works
Each team is ranked separately according to six key variables (listed below). For the most part, the lower the ranking the better—the only exception being ease of schedule, where a lower ranking simply implies an easier schedule. For example, a team ranked #1 in recruiting means that, in theory, they were the most talented team throughout the 2005-2009 time period. The rankings correlate with a team’s overall win percentage during the 2005-2009 time period, and they basically state “this is why each team had the winning percentage that they did during this time frame.” I think it will make this concept easier to digest if I only introduce two variables at a time.

The more complicated version: Team Win % = bo + b1R + b2D + b3S + b4H + b5CL + b6G + ε
- R — Recruiting Ranking
- D — Player Development Ranking
- S — Ease of Schedule Ranking
- H — Home Field Impact Ranking
- CL — Clutch or Luck Factor Ranking
- G — Gameday Factors Ranking
The b‘s are parameters to be estimated, and ε is a random error term.
Ease of Schedule Ranking
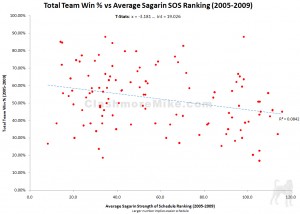
The ease of schedule ranking is determined by taking the five year average Sagarin strength of schedule ratings (2005-2009) and then ranking each team’s average schedule from easiest to hardest. The graph on the left is not showing this ranking, but rather the actual relationship between overall win percentage and the actual Sagarin SOS rankings. What jumps out at me is that the trend is essentially saying that the harder the schedule, the better a team’s expected performance. This doesn’t make any logical sense, and the low fit of the trend line with the actual data suggests that there is not a strong relationship between how many games a team wins and its strength of schedule—at least not when you’re looking at SOS by itself.
So, for example, while many bemoan that Boise State relies on their weak schedule to be successful each year, there are plenty of teams with equally weak or even weaker schedules who cannot replicate Boise State’s success. On the other end of the spectrum, Florida played the third hardest average schedule over the last five years, according to Sagarin, yet also won the national championship twice in that time. While SOS is actually statistically significant and worth looking at, it hardly seems all that deterministic. Instead, SOS needs to be looked at in conjunction with the other variables involved in this study to be of real use.
Ease of Schedule from ND’s Perspective
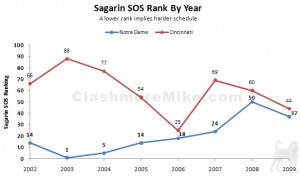
Think scheduling has been on the minds of ND fans lately? Former Athletic Director Kevin White’s head-scratching scheduling model is out the window, but the 2010 season still features some opponents that are not exactly going to excite many Irish fans. While the Utah game has all the appearances of being one of those under-the-radar matchups that could prove to be the most difficult game outside of USC on ND’s schedule, Western Michigan, Tulsa, and Army are essentially lay-ups. This year’s schedule should prove to be ‘easier’ than just about any recent ND schedule and will continue a general trend of easier schedules that began when Kevin White became A.D.
But while 2007-2009 were some of the easiest schedules in recent Irish history, the results were, frankly, terrible: a 43% winning percentage during those three seasons. In that same time period, the Kelly-lead Cincinnati program played a somewhat comparable schedule with much less talent and came away with an 83% winning percentage (only Boise State, Texas, and Florida had a higher winning percentage during those three years). This, in a microcosm, supports the assertion that ease of schedule is not as important of a variable as people make it out to be—highly-rated talent and an easy schedule don’t guarantee anything. Despite the relatively easier schedule the past few seasons, Notre Dame still had the 21st hardest average schedule since 2005. With Oklahoma, Texas, and Miami all on the docket for future Irish schedules, it’s likely that the recent trend of easier schedules is about to end. But as has been shown, that’s not really anything to worry too much about as long as the other program variables are up to snuff.
Home Field Impact Ranking
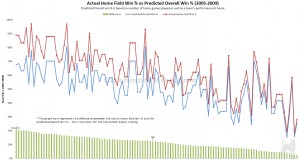
Home field impact ranking is sorted by the difference between a team’s actual five-year home game win percentage versus it’s expected five-year overall win percentage based on home field factors. The lower the ranking, the larger the home field advantage a team is considered to have (represented on the graph to the left). The intent of this ranking is to represent how much of an advantage some teams have over others in terms of the difficulty of their home stadium for opponents, as well as the leverage that program has in scheduling a large number of home games each year.
The reason we’re using a predicted overall win percentage for the comparison is because it provides a better basis for evaluating how a team is expected to perform overall given its normal performance at home as well as the number of games played at home. By doing it this way, we can use the expected overall performance to show that teams like Ohio State do indeed have a huge home field advantage; if you compare Ohio State with their actual overall win percentage, the advantage of playing at home looks minimal (about a 4% difference). But the estimated overall percentage shows that there’s actually a huge home game advantage for the program (about a 20% difference).
We don’t directly compare a team’s home win percentage with its away win percentage because doing so doesn’t take into account the previously mentioned factors (number of games at home, etc.). That, and it’s more of a measure of which teams utilize their home field as a crutch (Kansas State for example, won 71% of its home games, but only 17% of its away games) rather than teams that have a significant home advantage over the average team during each home game.
Lastly, it’s important to note that this method shows that every team has some kind of advantage from playing at home versus away. Even lowly Eastern Michigan, owner of the worst home field impact ranking, has about a 2% positive difference between their actual home winning percentage and their expected win percentage.
When discussing the concepts behind this ranking with other stat-heads, a few issues were brought up: first, the definition of a home game is becoming increasingly murky (i.e. how does one classify ND vs. Washington St. in San Antonio, or ND vs. Miami at Soldier Field—are these really neutral sites?); second, some voiced that this metric was more of a scheduling thing than a true measure of a “home field advantage;” third, it’s been said that this metric seems like it could be skewed because teams that schedule a lot of cupcakes each year will appear to have a better home game record.
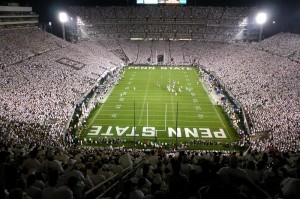
So, for now, let’s just define home games as games played in a team’s home stadium. As far this ranking appearing to be measuring a scheduling thing rather than a true home field advantage: if a team has more leverage than other teams to schedule an above average number of home games, that’s an advantage. The top ten home impact teams play an average of 10% more home games per year than the bottom 10 teams. Additionally, some stadiums are definitely harder for visiting teams than others. While Sagarin standardizes home field advantage to be the same for every home team across the board, I don’t think that’s a fair reflection of what the college football universe looks like. Who can say that Penn State (56% of games at home) with 100,000+ fans at each game has the same home field advantage as Eastern Michigan (37% of games at home), who cannot even fill a stadium fit for a large high school?
Finally, while one can look at Florida (ranked 5th in home field impact) and say, “Hey, they play teams like Charleston Southern at home, so of course they have a higher home winning percentage,” you’d be neglecting the fact that, again, Florida played the 3rd toughest schedule in the country over the last five years. Their 2008 schedule, for example, featured home games versus Miami, Mississippi, LSU, and South Carolina. I think that conference schedules will cancel out cupcake games in the long-run, and so it shouldn’t skew this ranking a whole lot.
Home field impact will be discussed in greater depth as it relates to college football as a whole in a later article.
Home Field Impact from ND’s Perspective
To put it bluntly, Notre Dame does not have the home field impact of other elite and/or successful programs—the Irish possess a less-than-impressive ranking of 55th. It’s important to note that this metric is tracking the “boost” a team should get from its home games, not specifically its winning percentage at home. So what it’s saying is that Notre Dame only has the 55th best “boost” in its performance from home games—not much of an advantage.
From a purely qualitative standpoint, Notre Dame crowds tend to be rather tame in comparison to, say, crowds at SEC schools. Anyone that has ever been to a Notre Dame game and has received the “SIT DOWN!” treatment from a 60 year old couple knows this all too well. Notre Dame stadium-goers are often yuppy tourists that are there to experience a Notre Dame game, not actually participate in it.
Other issues: like clockwork, NBC takes a 5 minute commercial break after just about any key play which completely kills any kind of crowd involvement. Also, only playing day games contributes to a tamer crowd because:
- The atmosphere is simply more dramatic at night games.
- Night games allow more time to drink prior to the game, which will lead to a more raucous crowd.
An increase in alcohol consumption is the reason why Notre Dame doesn’t play night games, from my understanding, and so don’t expect that part to change (I’m not necessarily suggesting that it should, only that other programs do have night games and it helps them).
Finally, the school wants its stadium to be as family-friendly as possible and lately has gone to extreme measures to maintain that appearance—to the point that you could be removed from a game just by appearing to be intoxicated, and banned from future games if you actually were intoxicated. Even alumni were not immune from this treatment. Nobody wants a drunk guy puking on them during a football game, but having to look over your shoulder for an usher eye-balling you if you’re standing and yelling is not exactly going to encourage fans to go crazy during games.
So what can be done to make the stadium more difficult for opponents? I’m not suggesting that the Irish lose any traditions, encourage binge drinking, install a jumbotron, or pipe in crowd noise. But small things like figuring out how to encourage the crowd to actually stand throughout the game and get involved (especially on the South side of the stadium) would help. Brian Kelly and Jack Swarbrick have already gotten NBC to agree to shorter commercial breaks, but a lot more could still be done there: how about actually specifying that breaks can only be taken after touchdowns, unblocked punts, during timeouts, and other similar plays that won’t kill crowd interest? The administration could also stand to be less draconian about keeping the stadium family-friendly on game day—I thought ushers were supposed to show you to your seats, not act as a security force? With all of that said, perhaps nothing would help more than reinvigorating the energy of the program after a nearly 15-year malaise: only time will tell if Kelly can accomplish that.
At the end of the day…
Institutional factors are something that Brian Kelly has some input on (the NBC commercial situation, for one), but the onus of leadership essentially falls onto current A.D. Jack Swarbrick. There’s little-to-no evidence to show that Notre Dame needs to schedule easier games to get to the national championship, and Swarbrick should concentrate on getting opponents on the slate that excite the Notre Dame fan-base. The recent addition of traditional football powers to future schedules gives reason for optimism. Of course, it will be up to the man whom Swarbrick hired, Brian Kelly, to get the program into a condition to be able to win those games.
Of greater concern, in my opinion, is finding a way to make Notre Dame stadium a more difficult venue for opposing teams to play in. When programs like Syracuse, Navy, Air Force, and Connecticut are coming onto campus and winning games, it says a lot about the difficulty of the home field, not just the quality of those specific Charlie Weis teams. Simply put: are other teams really all that intimidated about coming to South Bend?
I’ve elaborated briefly on some things that the administration can change, but Brian Kelly can glean something from one of his predecessor’s faults. The Irish need to regain a killer instinct. Visiting teams should not feel comfortable at Notre Dame stadium, and one way to get a psychological edge is by earning a reputation for burying inferior teams. Charlie Weis, when he had the chance, often simply chose to take his foot off the gas pedal, lest we embarrass the other team. What kind of message does that send to your team? Or to the other team for that matter? This isn’t pee-wee football, sometimes you have to bully and intimidate your opposition: it’s part of college football and being an elite program. Look at the 2008 Oklahoma results (with the exception of the bowl game) for guidance.
The third article in this series will look at on-the-field factors: clutch/luck ranking, and game day factors like play-calling and execution.


